Monitoring on AWS
This section assumes that you’re running zmon-aws-agent, which automatically discovers your EC2 instances, auto-scaling of groups, ELBs, and more.
ZMON AWS agent syncs the following entities from AWS infrastructure:
- EC2 instances
- Auto-Scaling groups
- ELBs (classic and ELBv2)
- Elasticaches
- RDS instances
- DynamoDB tables
- IAM/ACM certificates
Note
ZMON AWS Agent can be also deployed via a single appliance, which runs AWS Agent, ZMON worker and ZMON scheduler.
CloudWatch Metrics
You can achieve most basic monitoring with AWS CloudWatch. CloudWatch EC2 metrics contain the following information:
- CPU Utilization
- Network traffic
- Disk throughput/operations per second (only for ephemeral storage; EBS volumes are not included)
ZMON allows querying arbitrary CloudWatch metrics using the cloudwatch() wrapper.
Security Groups
Depending on your AWS setup, you’ll probably have to open particular ports/instances to access from ZMON. Using a limited set of ports to expose management APIs and the Prometheus node exporter will make your life easier. ZMON allows parsing of Prometheus metrics via the http().prometheus().
You can deploy ZMON into each of your AWS accounts to allow cross-team monitoring and dashboards. Make sure that your security groups allow ZMON to connect to port 9100 of your monitored instances.
Not having the proper security groups configured is mainly visible by not getting the expected results at all, as packages are dropped by the EC2 instance rather then e.g. getting a connection refused.
Low-Level or Basic Properties
EC2 Instances
Having enough diskspace on your instance is important; here’s a sample check. By default, you can only get space used from CloudWatch. Using Amazon’s own script, you can push free space to CloudWatch and pull this data via ZMON. Alternatively, you can run the Prometheus Node exporter to pull disk space data from the EC2 node itself via HTTP.
Similarly, you can pull CPU-related metrics from CloudWatch. The Prometheus Node exporter also exposes these metrics.
You also need enough available INodes.
Regarding memory, you can either query via CloudWatch, use Prometheus Node exporter to feed ZMON, or go with low-level snmp() [not recommended].
The following block shows part of EC2 instance entity properties:
id: a-app-1-2QBrR1[aws:123456789:eu-west-1]
type: instance
aws_id: i-87654321
created_by: agent
host: 172.33.173.201
infrastructure_account: aws:123456789
instance_type: t2.medium
ip: 172.33.173.201
ports:
  '5432': 5432
  '8008': 8008
region: eu-west-1
An example check using cloudwatch wrapper and entity properties would look like the following:
cloudwatch().query_one({'InstanceId': entity['aws_id']}, 'CPUUtilization', 'Average', 'AWS/EC2', period=120)
Elastic Load Balancers
You can query AWS CloudWatch to get ELB-specific metrics. The ZMON agent will put data into the ELB entity, allowing you to monitor instance and healthy instance count.
id: elb-a-app-1[aws:123456789:eu-west-1]
type: elb
elb_type: classic
active_members: 1
created_by: agent
dns_name: internal-a-app-1.eu-west-1.elb.amazonaws.com
host: internal-a-app-1.eu-west-1.elb.amazonaws.com
infrastructure_account: aws:123456789
members: 3
region: eu-west-1
scheme: internal
ZMON AWS agent will detect both ELBs, classic and application load balancers. Both ELBs entities will be created in ZMON with type:elb. In order to distinguish between them in your checks, there is another property elb_type which holds either classic or application.
Since Cloudwatch metrics are different for each ELB type, please check CloudWatch ELB metrics for detailed reference. An example check using Cloudwatch wrapper and entity properties would look like the following:
# Classic ELB
lb_name = entity['name']
key = 'LoadBalancerName'
namespace = 'AWS/ELB'

# Check if Application ELBv2 entity
if entity.get('elb_type') == 'application':
    lb_name = entity['cloudwatch_name']
    key = 'LoadBalancer'
    namespace = 'AWS/ApplicationELB'

cloudwatch().query_one({key: lb_name}, 'RequestCount', 'Sum', namespace)
Note
ELB entities contain a special flag dns_traffic which is an indicator about the load balancer being actively serving traffic.
Auto-Scaling Groups
ZMON’s agent creates an auto-scaling group entity that provides you with the number of desired instances and the number of instances in a healthy state. This enables you to monitor whether the ASG actually works and hosts spawn into a productive state.
id: asg-proxy-1[aws:123456789:eu-central-1]
type: asg
name: proxy-1
created_by: agent
desired_capacity: 2
dns_traffic: 'true'
dns_weight: 200
infrastructure_account: aws:123456789
instances:
- aws_id: i-123456
  ip: 172.33.109.201
- aws_id: i-654321
  ip: 172.33.109.202
max_size: 4
min_size: 2
region: eu-central-1
RDS Instances
ZMON AWS agent will detect RDS instances and store them as entities with type database.
id: rds-db-1[aws:123456789]
type: database
name: db-1
created_by: agent
engine: postgres
host: db-1.rds.amazonaws.com
infrastructure_account: aws:123456789
port: 5432
region: eu-west-1
cloudwatch().query_one({'DBInstanceIdentifier': entity['name']}, 'DatabaseConnections', 'Sum', 'AWS/RDS')
ElastiCache Redis
Elasticache instances are stored as entities with type elc.
id: elc-redis-1[aws:123456789:eu-central-1]
type: elc
cluster_id: all-redis-001
cluster_num_nodes: 1
created_by: agent
engine: redis
host: redis-1.cache.amazonaws.com
infrastructure_account: aws:123456789
port: 6379
region: eu-central-1
IAM/ACM Certificates
ZMON AWS agent will also sync IAM/ACM SSL certificates, with type certificate. Certificate entities could be used to create an alert in case a certificate is about to expire for instance.
id: cert-acm-example.org[aws:123456789:eu-central-1]
type: certificate
name: '*.example.org'
status: ISSUED
arn: arn:aws:acm:eu-central-1:123456789:certificate/123456-123456-123456-123456
certificate_type: acm
created_by: agent
expiration: '2017-07-28T12:00:00+00:00'
infrastructure_account: aws:123456789
region: eu-central-1
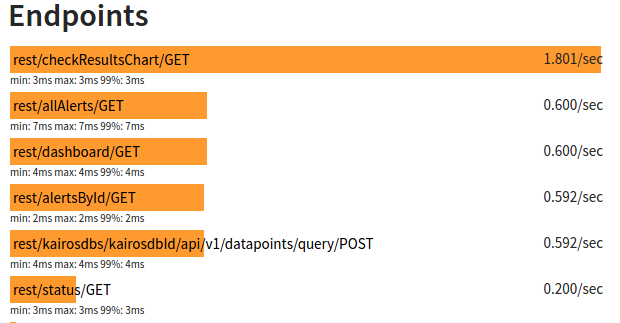
Application API Monitoring
When monitoring an application, you’ll usually want to check the number of received requests, latency patterns, and the number of returned status codes. These data points form a pretty clear picture of what is going on with the application.
Additional metrics will help you find problems as well as opportunities for improvement. Assuming that your applications provide HTTP APIs hidden behind ELBs, you can use ZMON to gather this data from CloudWatch.
For more detailed data, ZMON offers options for different languages and frameworks.
One is zmon-actuator for Spring Boot.
ZMON gathers the data by querying a JSON endpoint /metrics adhering to the DropWizard metrics layout with some convention on the naming of timers.
Basically on timer per API path and status code.
We also recommend checking out Friboo for working with Clojure, the Python/Flask framework Connexion or Markscheider for Play/Scala development.
The http(url=…).actuator_metrics() will parse the data into a Python dict that allows you to easily monitor and alert on changes in API behavior.
This also drives ZMON’s cloud UI.